
When You Find the Signs of "The Equation" in Existing Data
A personal account of the day the source construction reached an experimental record: 73.22% to 82.28% prediction accuracy, and a concrete question for the next experiment.
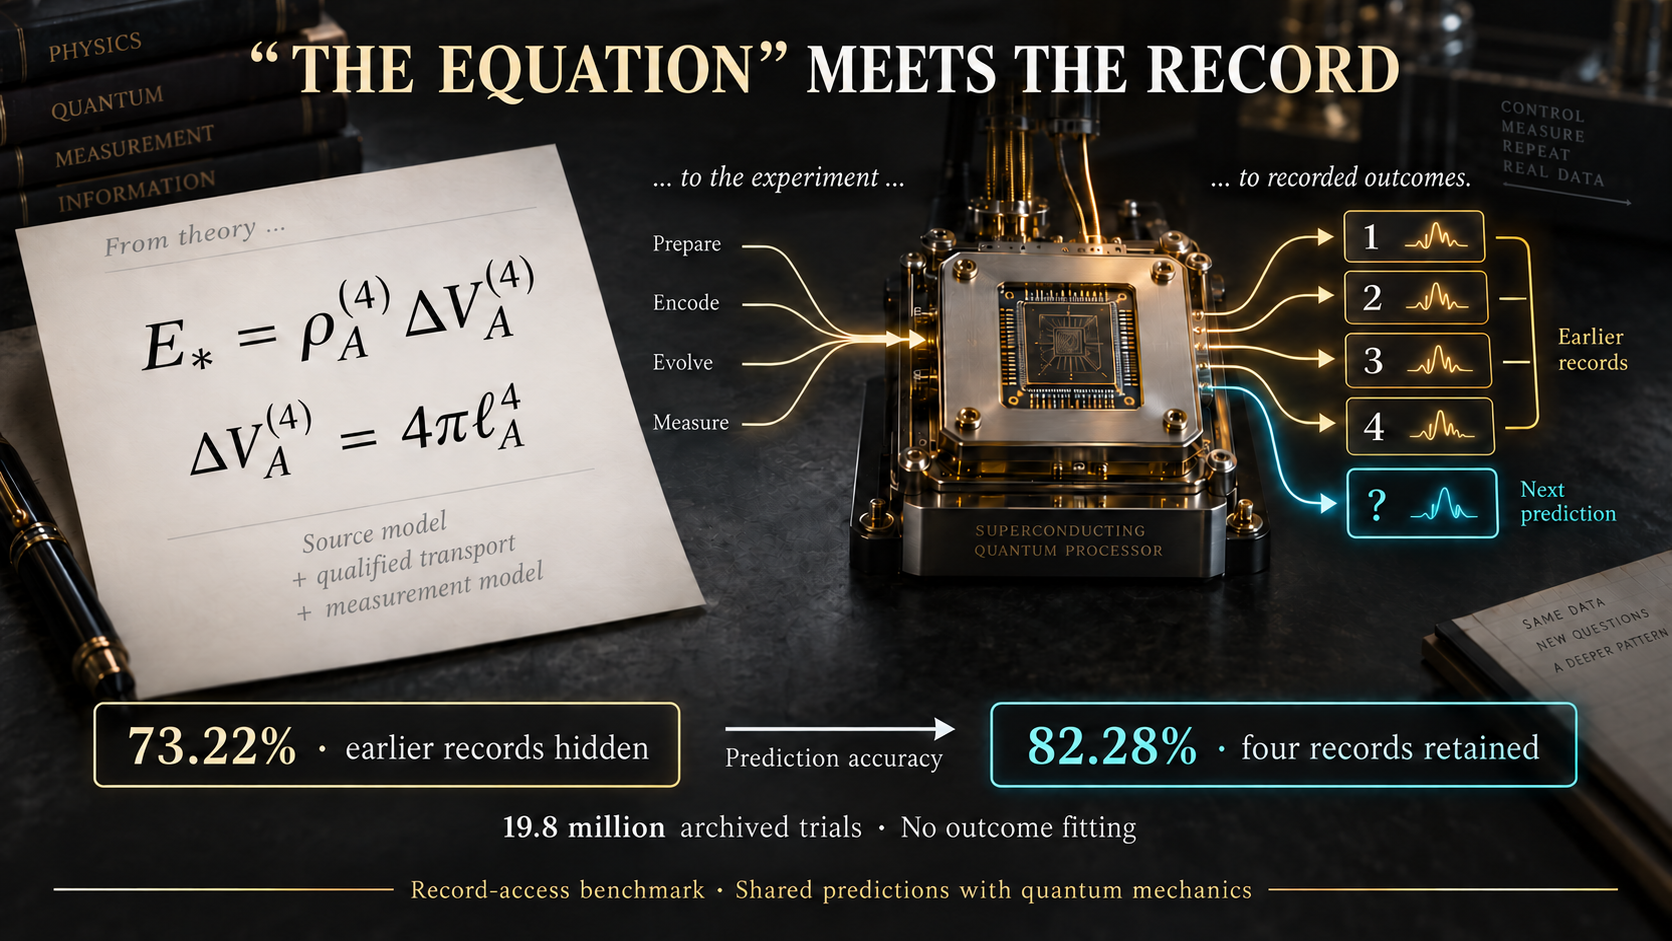
This was my day, in every sense. For a long time, I have been writing about a universe built from completed physical events, and asking what that picture should look like in an actual measurement. Today, I could follow the construction all the way into an experimental archive and put numbers beside it.
What happened went beyond my expectation. Across 495 settings of a superconducting quantum processor, keeping four earlier measurement records raised the accuracy of the next-outcome forecast from 73.22% to 82.28%. No outcome probabilities were adjusted to make that improvement appear.
I felt that I could finally see something recognizable from the framework in the data. That is a personal reaction to a concrete result. Scientifically, the result is a reproducible record-access benchmark: the QTT construction reaches real detector records and quantifies what becomes predictable when more of their history is available. Whether nature chooses QTT's underlying ontology over the matched quantum description remains a further question.
Here is what we actually did, and why I think it deserves attention.
Field Notes · From Source to RecordsFour readings and a fifth question
Imagine watching a quantum experiment produce a sequence of zeros and ones. You know how the apparatus was programmed. Four measurements have already happened. Your task is to forecast the fifth.
You can do that with different amounts of information. First, hide all four earlier readings. Then reveal only the latest one. Finally, reveal all four. The physical experiment is identical in every comparison. Only the information available to the calculation changes.
In the superconducting archive, the measured performance was:
| Earlier readings available | Correct forecasts | What the comparison asks |
|---|---|---|
| None | 73.22% | What can the circuit settings alone tell us? |
| Only the latest reading | 79.79% | How much does the most recent outcome help? |
| All four readings | 82.28% | Does the older history still add information? |
The last comparison is the one that caught my attention. Older records add another 2.49 percentage points beyond the latest reading alone. Some useful information is spread across the history; the most recent detector result does not summarize all of it.
There is no reason the starting score should be 50%. The circuit settings already make some outcomes more likely than others. The meaningful result is the extra predictive value of the record, judged against that informed baseline.
These numbers cover all 495 settings and 19.8 million archived trials. They come from a new analysis of the open recurrence dataset published by Quancheng Liu, Sabine Tornow, David A. Kessler and Eli Barkai. Their study, Fractionally Quantized Recurrence Detection Times in Monitored Quantum Many-Body Systems, includes an experiment on IBM's superconducting quantum processor, ibmq_sherbrooke. In ordinary language, they studied how a repeatedly measured quantum system returns to its starting state. The apparatus and measurements are their work; the record-deletion benchmark is the analysis reported here.
Field Notes · From Source to RecordsWhat the equation has to do with it
The equation behind my excitement is the fourth face of QTT's Unified Equilibrium Law:
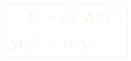
In plain language, the proposal assigns a finite physical support to a completed event, and relates that support to a source energy scale.
Artian's Ruler, written as ell-A in the equation, is the source length. In QTT's Newtonian correspondence it has the same numerical value as the conventional Planck length, approximately 1.616255 × 10⁻³⁵ metres. The physical meaning and mathematical construction are different. The conventional Planck length is calculated from Newton's gravitational constant, the speed of light and Planck's constant. QTT starts with a physical source ruler in its completed-event geometry, then derives the gravitational coupling from the endurance and capacity rules. The matching numerical length is reached through that correspondence; it is not what defines the source geometry in the first place.
The four-capacity has units of length to the fourth power: spatial support carried through a source stride. The other factor, rho, expresses its energy valuation. It is not the usual energy per three-dimensional volume, and the fourth power does not mean another direction through the laboratory.
The completed-event four-capacity paper gives the source construction. The new empirical paper explains its role without requiring a reader to know that earlier work.
But an energy-capacity equation cannot, by itself, tell you which light flashes on a particular detector. You need the physical transport, how systems interact, the measurement model and the actual apparatus controls. The useful achievement here is making those connections explicit:
The common source-capacity scale cancels in the normalized probabilities. So the archive does not measure the number 4-pi or Artian's Ruler. What reaches the data is the record instrument built with the additional stated assumptions. That is the precise sense in which I am finding signs of the construction in existing data.
Field Notes · From Source to RecordsHiding a record does not undo an event
This distinction matters enormously for the physical story.
We did not remove a detector or rerun the experiment with a different interaction. We hid selected outcomes from the calculation after they had been recorded. Whatever physically happened in the apparatus still happened.
In QTT's proposed ontology, that is the distinction between the completed physical history and the part of it we can access. A missing entry in our information does not mean a missing event in the world.
The calculation therefore adds together the possible hidden histories. It does not replace their interactions with empty space. This gives a specific probability for the outcome being forecast, rather than a general statement that "information matters."
For the model's exact conditional forecasts, the information budget obeys:
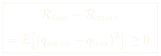
Here q is the forecast probability, and R is its average squared error. If the extra record changes the best forecast, it has a calculable value. The error reduction equals the average squared change in that forecast.
This identity is established probability mathematics. The contribution of this work is connecting a declared source construction and a physical measurement model to the probabilities on both sides, then executing the comparison on experimental records. Finite samples and an imperfect apparatus model can produce local departures; the observed data still have to be checked.
Field Notes · From Source to RecordsNo fitted outcomes, and no discarded awkward results
The calculation uses the published circuit controls. It does not learn a noise rate, contrast correction or outcome-probability adjustment from the outcomes being scored. The fifth outcome is withheld from its own forecast, and later readings are not used to predict it.
The archive was already available when this analysis was designed. This is a retrospective reconstruction, not a prediction sealed before the experiment. Seven record selections were fixed for the reported calculation, and every setting was retained.
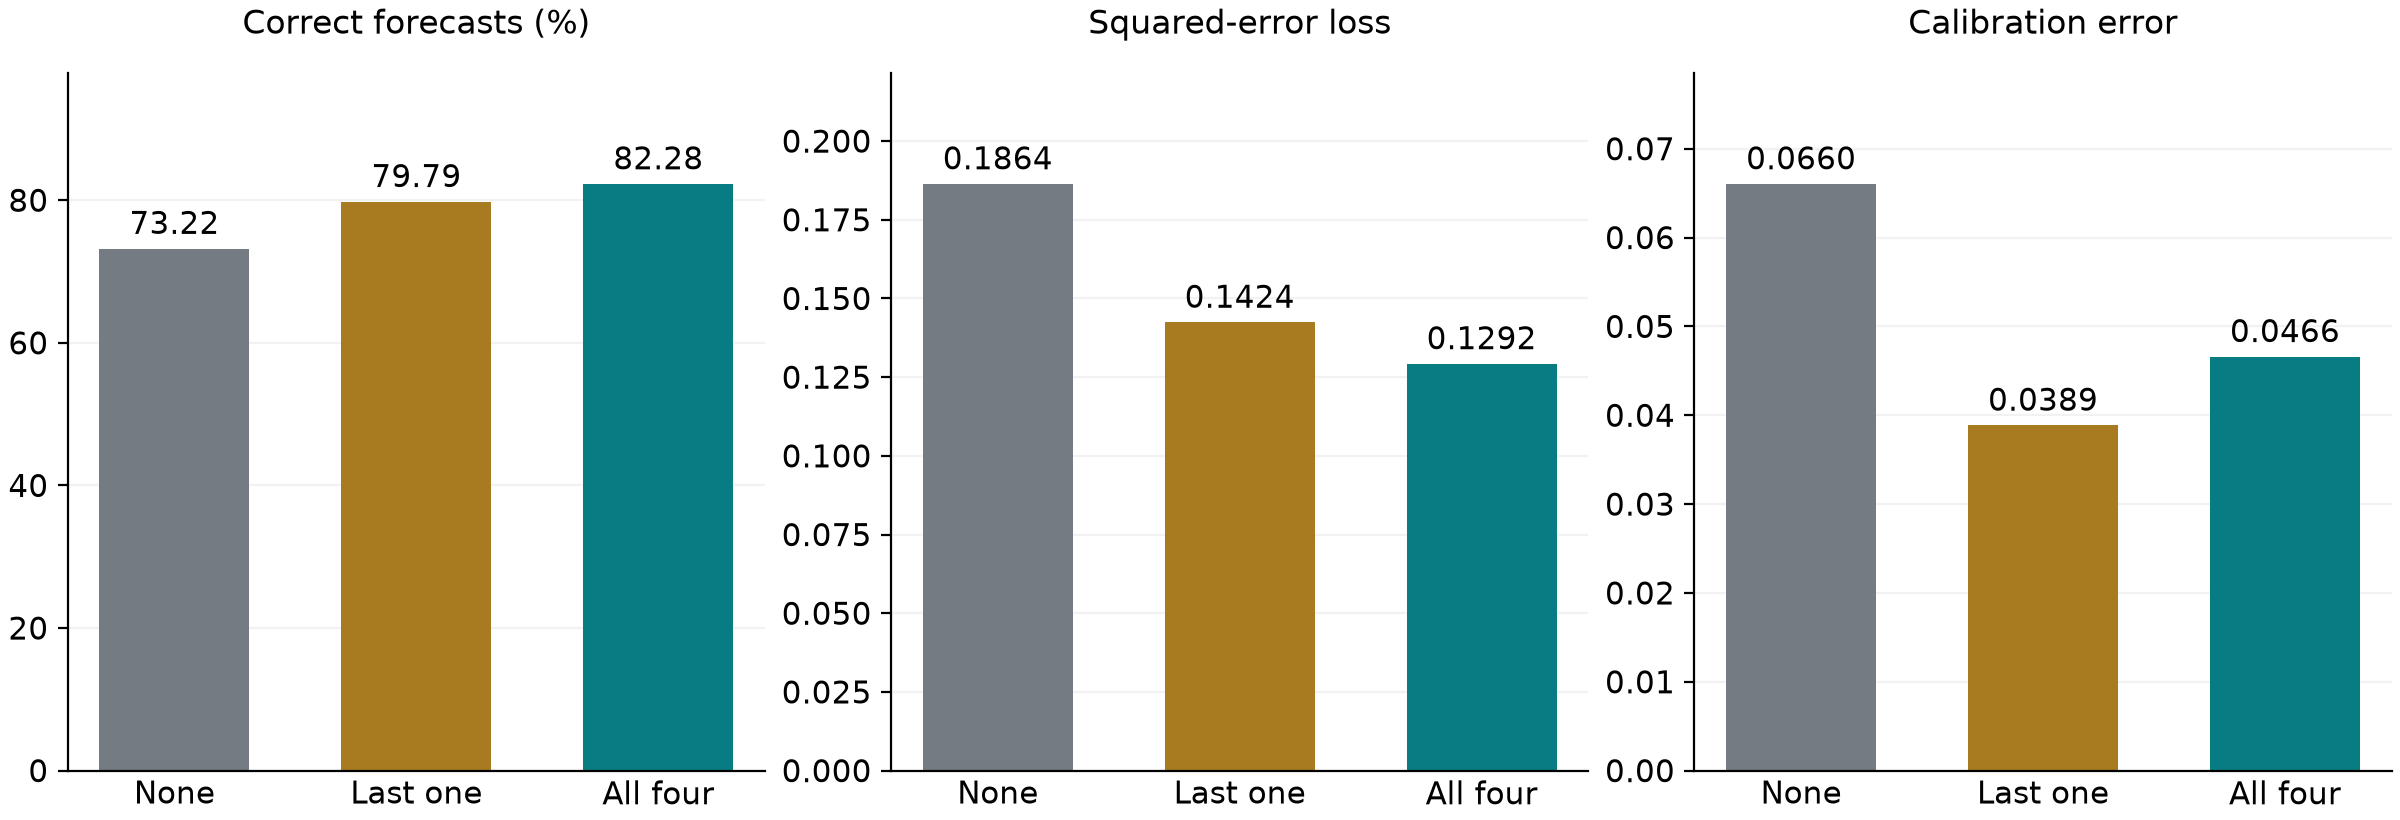
Open the results chart at full resolution.
I wanted the probability check as well as the success rate. A forecast that says "80%" should be right about eight times in ten in comparable cases. Getting more guesses right does not automatically mean its confidence is correct.
The full record improves overall accuracy and squared-error loss, but its calibration error is higher than for the latest-reading-only forecast. Twenty-eight settings worsen in squared-error loss when all four records replace no earlier record. Also, 3.25% of trials have earlier histories that the ideal model assigns zero probability. Those trials remain in the analysis with an explicit 50:50 fallback, and the paper reports how that choice affects the result. There is work left to do on the apparatus description.
That is why the full package matters. A reader can examine the favorable result and the awkward parts together.
Field Notes · From Source to RecordsThe second platform
The paper also preserves the complete trapped-ion analysis from Xiaozhou Feng, Jeremy Côté, Stefanos Kourtis and Brian Skinner's open experimental archive. Their experiment, Postselection-free experimental observation of the measurement-induced phase transition in circuits with universal gates, used Quantinuum's H1-1 trapped-ion processor. It studied how changing measurement strength changes the information that quantum circuits retain. Our record-access task runs the inference in the other direction: given later measurement records, how well can we infer the initial preparation?
It contains 32,000 tree records from 6,400 hardware shots, with five measurement strengths. At the strongest setting, two early outcomes give 72.27% accuracy and the complete history gives 74.41%. The analysis checks seven ways of hiding records across all five strengths, including probability calibration.
These are two different tasks on two different platforms. We do not add their counts together and call them one giant significance score. Their value is that the source-to-record construction can be implemented and examined in both settings.
Field Notes · From Source to RecordsWhy this matters for QTT
QTT asks a physical question underneath the familiar calculation: what is carrying the phase, what completes an event, and how does a restricted record emerge from that process?
Today, that proposed explanation comes with an executable laboratory example. Someone who has never heard of QTT can start with the circuit, reproduce the probabilities, hide the same records and check the scores. The source interpretation is exposed to examination at every step.
Ordinary quantum mechanics gives the same probabilities for these matched instruments, using the same circuit inputs and no outcome fitting either. There is no fitted-comparator advantage to claim in this particular benchmark. The experiment demonstrates the predictive value of access to the record; it does not yet choose between those two underlying accounts.
What is new in this work is the explicit, reproducible connection between the QTT source account, the detector instrument and the information retained across two public archives.
Field Notes · From Source to RecordsThe experiment I want next
The next step is to determine a physical interaction or response coefficient independently, before looking at the outcomes it will be used to predict. Then freeze the detector predictions and test new preparations and circuit settings without readjusting the coefficient.
That would test whether the source construction can tell us something about the apparatus that we otherwise have to supply. To select QTT over a competing model, we will also need their frozen predictions or independently audited input requirements to differ. The follow-up must retain its calibration failures and unfavorable settings just as this analysis does.
I would be delighted to hear from an experimental group willing to make that comparison. The present paper supplies the calculations, data references and reconstruction tools, so a conversation can begin with something that already runs.
Field Notes · From Source to RecordsA personal thank-you to the experimental teams
To Quancheng Liu, Sabine Tornow, David A. Kessler and Eli Barkai: thank you for sharing the superconducting recurrence data. The 19.8 million archived trials behind the headline result exist because of your experimental work and your decision to make the records available.
To Xiaozhou Feng, Jeremy Côté, Stefanos Kourtis and Brian Skinner: thank you for sharing the trapped-ion circuits, measurement records and analysis code. That level of openness lets another researcher follow the calculation back to the actual experiment, not just to a figure in a paper.
Both teams gave other researchers something valuable: the chance to ask a new question of an experiment already completed. This analysis would not have been possible without those public datasets. Credit for the original experiments belongs to them; the QTT interpretation and this reanalysis are my responsibility.
Field Notes · From Source to RecordsRead it, run it, question it
The public v2.0 paper and reconstruction package are available now. The paper is written for scientists who do not know QTT. It includes the full earlier analysis, the new superconducting results, the source assumptions and the calibration checks.
A fresh replay reproduced 17 scientific output files byte for byte and 14 numerical arrays exactly. That verifies the reproduction, not the truth of the ontology. It gives another researcher a concrete place to start.
This was the part of my day that stayed with me: I could stop pointing only at the equation and start pointing at a calculation someone else could run against real records. I want to see how far that connection goes.